 | 

The production of methylphenidate (Ritalin) and the legal production of
amphetamine in the form of Adderall and Dexedrine in the U.S. has soared since
1990. Since these drugs are considered to be potential drugs of abuse under the
Controlled Substances Act, the DEA sets quotas regulating the amount of the
drugs that may be produced each year to meet the demands for legitimate use, in
order to ensure that there is not a surplus of production which could lead to
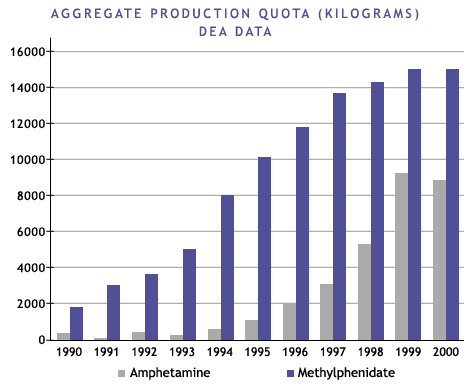
drug diversion and illegal use. The dramatically rising production
quotas shown below mirror the growing demand for prescriptions in the U.S.
According to the testimony of DEA Deputy Director Terrance Woodworth before the House Subcommittee on Early Childhood, Youth and Families in May
2000, the methylphenidate quota
increased from 1,768 kilograms in 1990 to 14,957 kilograms in 2000, and the
amphetamine quota increased from 417 to 9,007:
Source: http://www.dea.gov/pubs/cngrtest/ct051600.htm


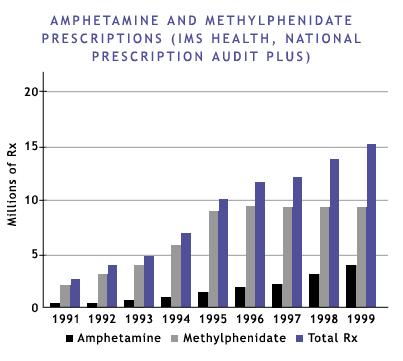
IMS Health is a private prescription auditing firm. According to their data,
the vast majority of prescriptions for amphetamine and methylphenidate are for
children diagnosed with ADHD. Methylphenidate prescriptions rose dramatically
in the early 1990s and have since leveled off at approximately 11 million per
year. In comparison, amphetamine prescriptions, primarily Adderall, have
increased dramatically recently, from 1.3 million in 1996 to nearly 6 million
in 1999.
Source: http://www.dea.gov/pubs/cngrtest/ct051600.htm
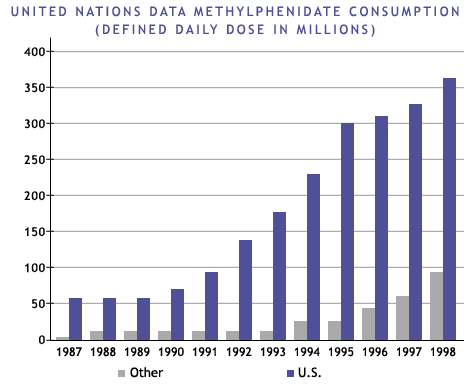
According to the United Nations, the U.S. produces and consumes about 85 percent of the world's methylphenidate.
Source: http://www.dea.gov/pubs/cngrtest/ct051600.htm



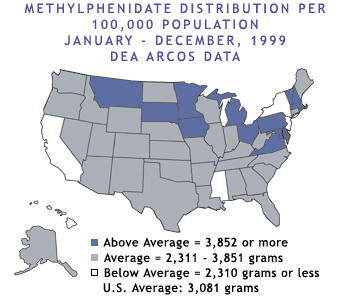
Source: http://www.dea.gov/pubs/cngrtest/ct051600.htm
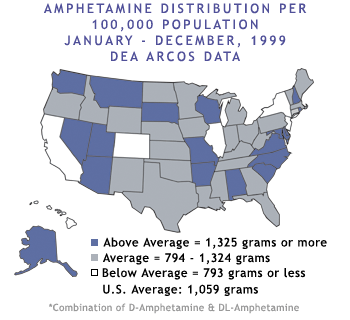
The DEA also tracks Schedule II controlled substances from the point of
manufacture to the point of distribution to the consumer. This data reveals
that there is wide variation in the levels of use of methylphenidate and
amphetamine from state to state, and even among communities within states. This
implies that there may be both under-prescription and over-prescription of
medication for ADHD across the U.S., depending on the community.
The top five ranking states in 1999 for methylphenidate and amphetamine use
were: New Hampshire (5,525 grams per 100,000 population); Vermont (5,005);
Michigan (4,848); Iowa (4,638); and Delaware (4,439). The lowest ranking states
for use of methylphenidate were California (1,748) and Hawaii (1,208). For
amphetamine, the lowest ranking were New York (509) and Hawaii (305).
The average per capita use of methylphenidate across the United State was 3,082
grams per 100,000 population; for amphetamine it was 1,060 per 100,000.

home · watch the program · four families · adhd drugs · adhd · backlash
readings · adhd in schools · interviews · discussion · the producers · viewers' guide
synopsis · tapes & transcripts · press reaction · credits
frontline · wgbh · pbs online
pill photograph copyright ©2001 photodisc all rights reserved
web site copyright WGBH educational foundation
|