|
History certainly gives credence to this concern. In the balance of this
chapter, we study the historical record. Although the discussion in this
chapter gets pretty detailed, I urge you to follow its thread, for the details
place today's situation in a useful, and quite revealing, context.

Market Heights
By historical standards, the U.S. stock market has soared to extremely high
levels in recent years. These results have created a sense among the investing
public that such high valuations, and even higher ones, will be maintained in
the foreseeable future. Yet if the history of high market valuations is any
guide, the public may be very disappointed with the performance of the stock
market in coming years.
An unprecedented increase just before the start of the new millennium has
brought the market to this great height. The Dow Jones Industrial Average (from
here on, the Dow for short) stood at around 3,600 in early 1994. By 1999, it
had passed 11,000, more than tripling in five years, a total increase in stock
market prices of over 200%. At the start of 2000, the Dow passed 11,700.
However, over the same period, basic economic indicators did not come close to
tripling. U.S. personal income and gross domestic product rose less than 30%,
and almost half of this increase was due to inflation. Corporate profits rose
less than 60%, and that from a temporary recession-depressed base. Viewed in
the light of these figures, the stock price increase appears unwarranted and,
certainly by historical standards, unlikely to persist.
Large stock price increases have occurred in many other countries at the same
time. In Europe, between 1994 and 1999 the stock market valuations of France,
Germany, Italy, Spain, and the United Kingdom roughly doubled. The stock market
valuations of Canada, too, just about doubled, and those of Australia increased
by half.
In the course of 1999, stock markets in Asia (Hong Kong, Indonesia, Japan,
Malaysia, Singapore, and South Korea) and Latin America (Brazil, Chile, and
Mexico) have made spectacular gains. But no other country of comparable size
has had so large an increase since 1994 as that seen in the United States.
Price increases in single-family homes have also occurred over the same time
but significant increases have occurred in only a few cities. Between 1994 and
1999 the total average real price increase of homes in ten major U.S. cities
was only 9%. These price increases are tiny relative to the increase in the
U.S. stock market.
The extraordinary recent levels of U.S. stock prices, and associated
expectations that these levels will be sustained or surpassed in the near
future, present some important questions. We need to know whether the current
period of high stock market pricing is like the other historical periods of
high pricing, that is, whether it will be followed by poor or negative
performance in coming years. We need to know confidently whether the increase
that brought us here is indeed a "speculative bubble" -- an unsustainable
increase in prices brought on by investors' buying behavior rather than by
genuine, fundamental information about value. In short, we need to know if the
value investors have imputed to the market is not really there, so that we can
readjust our planning and thinking.

A Look at the Data
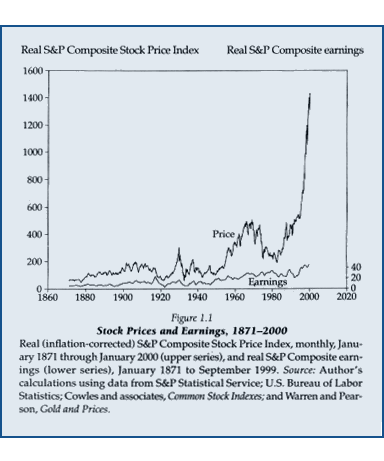
Figure 1.1 shows, for the United States, the monthly real (corrected for
inflation using the Consumer Price Index) Standard and Poor's (S&P)
Composite Stock Price Index from January 1871 through January 2000 (upper
curve), along with the corresponding series of real S&P Composite earnings
(lower curve) for the same years. This figure allows us to get a truly
long-term perspective on the U.S. stock market's recent levels. We can see how
differently the market has behaved recently as compared with the past. We see
that the market has been heading up fairly uniformly ever since it bottomed out
in July 1982. It is clearly the most dramatic bull market in U.S. history. The
spiking of prices in the years 1992 through 2000 has been most remarkable: the
price index looks like a rocket taking off through the top of the chart! This
largest stock market boom ever may be referred to as the "millennium boom."

Yet this dramatic increase in prices since 1982 is not matched in real earnings
growth. Looking at the figure, no such spike in earnings growth occurs in
recent years. Earnings in fact seem to be oscillating around a slow, steady
growth path that has persisted for over a century.
No price action quite like this has ever happened before in U.S. stock market
history. There was of course the famous stock run-up of the 1920s, culminating
in the 1929 crash. Figure 1.1 reveals this boom as a cusp-shaped price pattern
for those years. If one corrects for the market's smaller scale then, one
recognizes that this episode in the 1920s does resemble somewhat the recent
stock market increase, but it is the only historical episode that comes even
close to being comparable to the present boom.
There was also a dramatic run-up in the late 1950s and early 1960s, culminating
in a flat period for half a decade that was followed by the 1973-74 stock
market debacle. But the price increase during this boom was certainly less
dramatic than today's.

Price Relative to Earnings
Part of the explanation for the remarkable price behavior between 1990 and 2000
may have to do with somewhat unusual earnings. Many observers have remarked
that earnings growth in the five-year period ending in 1997 was extraordinary:
real S&P Composite earnings more than doubled over this interval, and such
a rapid five-year growth of real earnings has not occurred for nearly half a
century. But 1992 marked the end of a recession during which earnings were
temporarily depressed. Similar increases in earnings growth have happened
before following periods of depressed earnings from recession or depression. In
fact, there was more than a quadrupling of real earnings from 1921 to 1926 as
the economy emerged from the severe recession of 1921 into the prosperous
Roaring Twenties. Real earnings doubled during five-year periods following the
depression of the 1890s, the Great Depression of the 1930s, and World War
II.
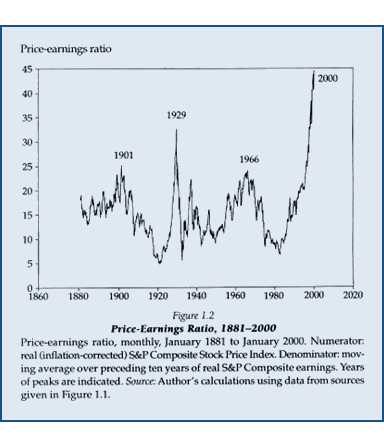
Figure 1.2 shows the price-earnings ratio, that is, the real
(inflation-corrected) S&P Composite Index divided by the ten-year moving
average real earnings on the index. The dates shown are monthly, January 1881
to January 2000. The price-earnings ratio is a measure of how expensive the
market is relative to an objective measure of the ability of corporations to
earn profits. I use the ten-year average of real earnings for the denominator,
along lines proposed by Benjamin Graham and David Dodd in 1934. The ten-year
average smooths out such events as the temporary burst of earnings during World
War I, the temporary decline in earnings during World War II, or the frequent
boosts and declines that we see due to the business cycle. Note again that
there is an enormous spike after 1997, when the ratio rises until it hits 44.3
by January 2000. Price-earnings ratios by this measure have never been so high.
The closest parallel is September 1929, when the ratio hit 32.6.

In the latest data on earnings, earnings are quite high in comparison with the
Graham and Dodd measure of long-run earnings, but nothing here is startlingly
out of the ordinary. What is extraordinary today is the behavior of price (as
also seen in Figure 1.1), not earnings.
There have been three other times when the price-earnings ratio as shown in
Figure 1.2 attained high values, though never as high as the 2000 value. ...

Worries about Irrational Exuberance
The news media have tired of describing the high levels of the market, and
discussion of it is usually omitted from considerations of market outlook. And
yet, deep down, people know that the market is highly priced, and they are
uncomfortable about this fact.
Most people I meet, from all walks of life, are puzzled over the apparently
high levels of the stock market. We are unsure whether the market levels make
any sense, or whether they are indeed the result of some human tendency that
might be called irrational exuberance. We are unsure whether the high levels of
the stock market might reflect unjustified optimism, an optimism that might
pervade our thinking and affect many of our life decisions. We are unsure what
to make of any sudden market correction, wondering if the previous market
psychology will return.
Even Alan Greenspan seems unsure. He made his "irrational exuberance" speech
two days after I had testified before him and the Federal Reserve Board that
market levels were irrational, but a mere seven months later he reportedly took
an optimistic "new era" position on the economy and the stock market. In fact,
Greenspan has always been very cautious in his public statements, and he has
not committed himself to either view. A modern version of the prophets who
spoke in riddles, Greenspan likes to pose questions rather than make
pronouncements. In the public exegesis of his remarks, it is often forgotten
that, when it comes to such questions, even he does not know the answers.
(c) 2000 by Robert J. Shiller
All rights reserved.
You may read and browse this material at this website. However, no
further copying, downloading or linking is permitted. No part of this
material may be further reproduced in any form by any electronic or
mechanical means (including photocopying, recording, or information
storage and retrieval) without permission in writing from the
publisher. Users are not permitted to mount this file on any network
servers.
For permission requests and to search our online catalog, please see
our website at www.pup.princeton.edu.

home · introduction · ipo game · crying foul · beyond the bubble · historical perspectives
discussion · interviews · readings & links · watch the program · producer's chat
tapes & transcripts · press reaction · credits · privacy policy
FRONTLINE · wgbh · pbs online
some photographs copyright ©1998 sam bailey
new content copyright ©2002 pbs online and wgbh/frontline
|